Weekly Auto Insights
The problem
You have sales data, but no time to look at it. Most business owners glance at last month’s revenue and move on. The stuff that actually matters — which products are slipping, which customers are going quiet, which weeks quietly outperform the rest — just gets missed.
See it in action
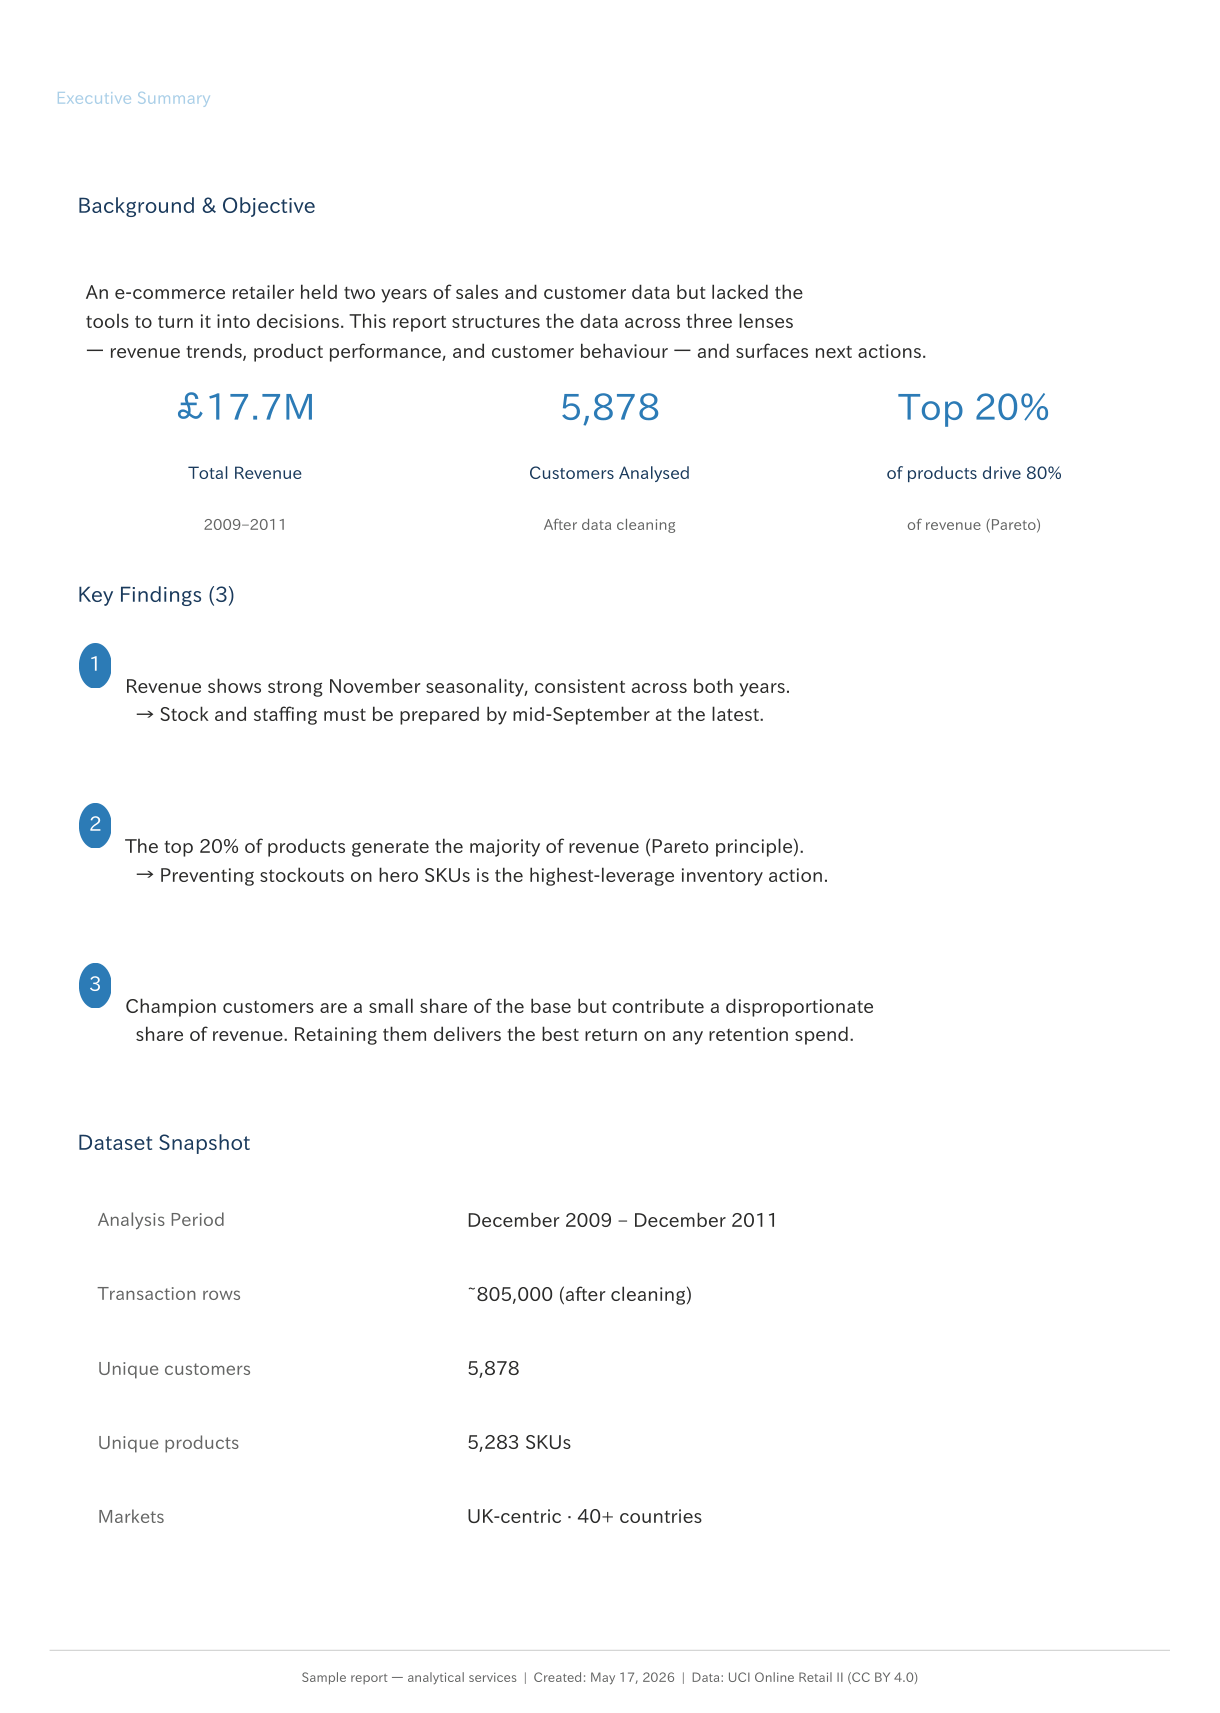
This is a real sample report, built from two years of retail transaction data. It’s what a client would receive in their inbox.
 |
 |
Download the full sample report (PDF)
How it works
1. Your Data: You share your sales data — a Google Sheet works well, or a CSV export if that’s easier.

2. Automatic Analysis Every week, the system reads your data, analyses it, and builds the summary report and charts — revenue trends, top products, customer behaviour. No one needs to touch anything.

3. Custom Report & Auto-Delivery A clean PDF lands in your inbox — or Teams, or Slack, wherever you want it. Each chart comes with a short note on what it means and what to do about it.

What you get
Each weekly report covers:
- Revenue trend — monthly and week-on-week, with year-on-year comparison
- Top products — which SKUs are driving revenue, and which are slipping
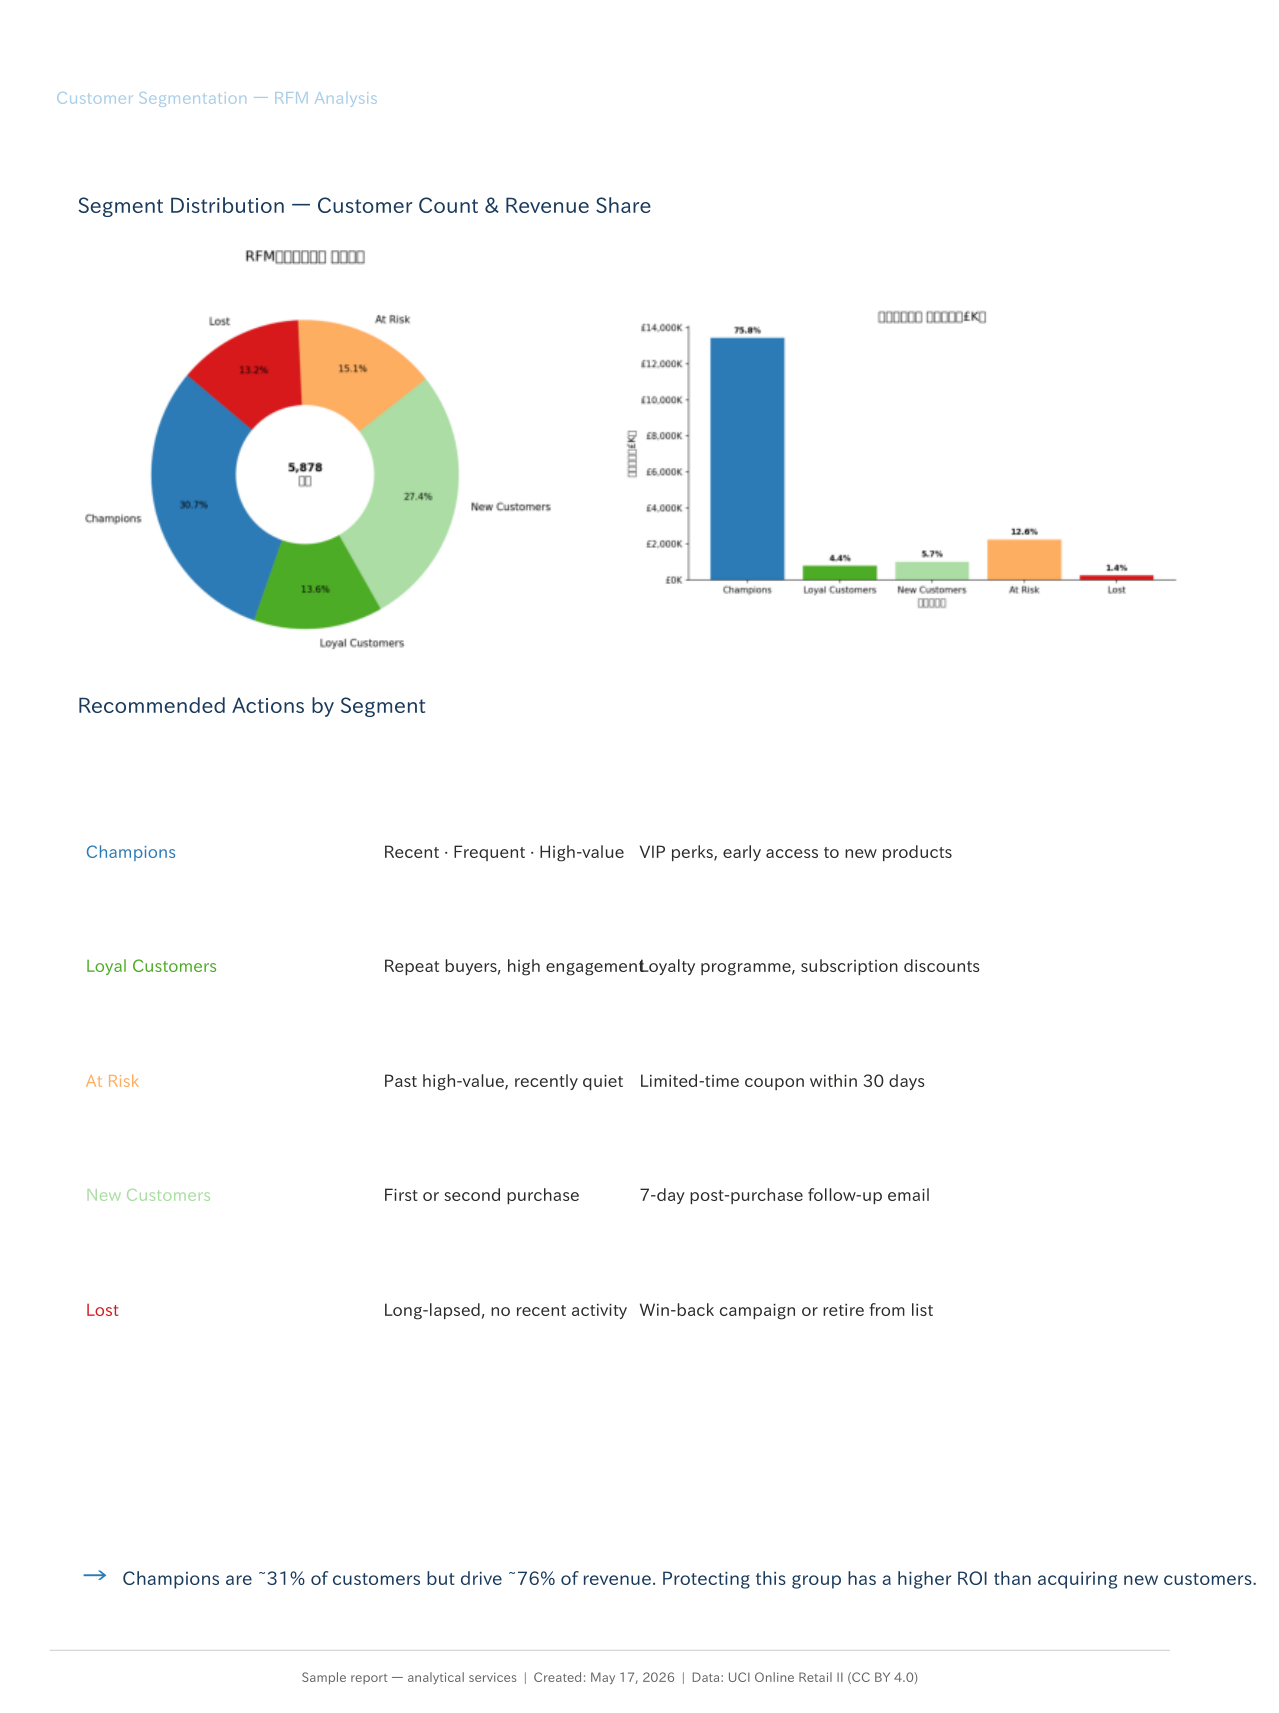
- Customer segments — who your best customers are, and which ones are going quiet
- What to do next — a short, specific note for each finding. Not just a chart, but a prompt.
Frequently asked questions
What data do I need to provide? An Excel or CSV file with your sales transactions — date, product, quantity, price, and customer ID. If your data looks different, get in touch and we can work it out.
How long does setup take? First report is typically ready within a few days of receiving your data.
Is the report customisable? Yes. The analyses, layout, language, and delivery frequency can all be adjusted to fit your business.
How much does it cost? Get in touch for a quote — scope and pricing depend on your data and what you need.
Interested?
Taking on new clients. If you want a report built around your own data, reach out.
Contact: nguyenandydevjp@gmail.com